|
|
Programming
The examples below are the programs written in R, C++, C:
 The "Gtrendscomp" web application is designed to compare Google Trends time series. "Gtrendscomp" is
based on "Shiny", a web application framework for the statistical language R, and hosted at
https://essine.shinyapps.io/Gtrendscomp/.
It can be downloaded for local installation at
https://github.com/essine/Gtrendscomp/ and requires
"RStudio", a free and open-source IDE for R language,
as well as R packages "shiny", "gtrendsR" and "forecast".
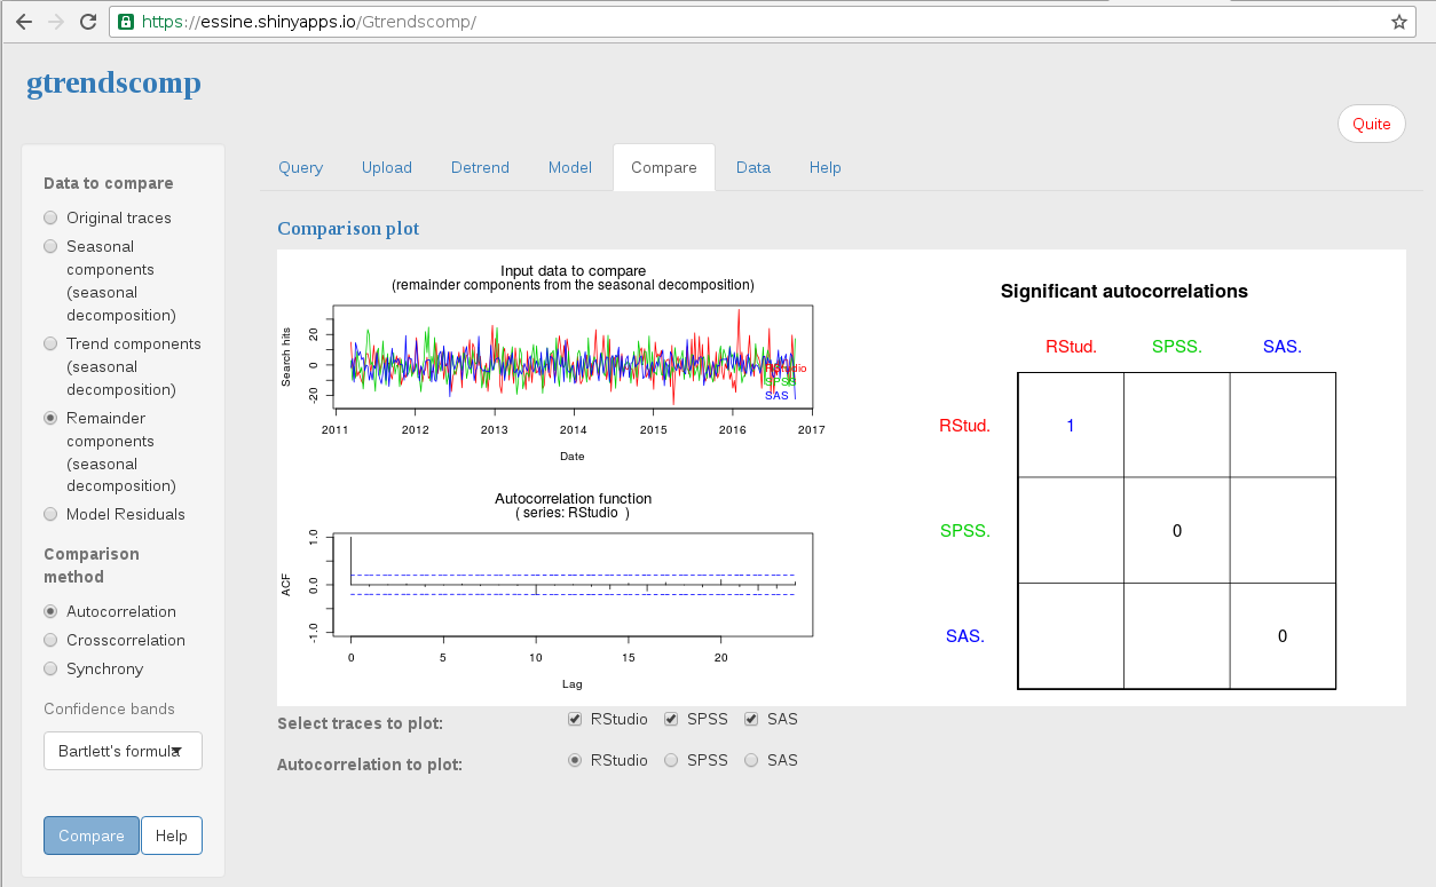 |
Screenshot of the "Gtrendscomp".
Google Trends data for keywords "RStudio", "SPSS", "SAS" between 2004 and 2017 are seasonally detrended and the
numbers of significant autocorrelation coefficients at all nonzero lags for the reminder components are calculated.
The reminder components are presented in plot "Input data to compare". The calculated data are shown in table "Significant autocorrelation".
|
The programs "Sparks Analysis” and "STOCs Analysis” are written in C++ and intended to analyze calcium
sparks detected with rapid line-scanning confocal microscopy and spontaneous transient outward currents
(STOCs) recorded by patch clamp method.
|
Screenshot of the "Sparks Analysis".
Ca2+ sparks are visualized by confocal line-scan imaging of a representative fluo-3–loaded smooth muscle cell (upper window).
The image is a plot of fluorescence along a scanned line (ordinate) vs. time (abscissa).
The fluorescence intensity is measured along the green line, which determines the time -course of the Ca2+ sparks (lower window).
The program estimates the amplitudes, widths, rise and decay times of Ca2+ sparks.
It performs moving average filtering and exponential fitting of the traces.
|
|
Screenshot of the "STOCs Analysis".
Superimposed individual STOC traces (green) and the average STOC trace (yellow) are shown in the signal window (upper left corner).
The program automatically detects STOCs and generates a database with the parameters of detected STOCs (lower left signal window).
The program allows to tune some parameters for STOCs analysis, for example, the amplitude of threshold level. The parameter window is located to the right from the signal window.
The program performs exponential fitting of the traces, histogram analysis and non-stationary
fluctuation analysis.
|
The program "Macrophylon" simulates the macroevolution of Chordata animals. The program is
written in C and requires DOSBox to run. The description of the model can be found at
http://geneura.ugr.es/macrophylon/intro.html..
|
Screenshot of the "Macrophylon".
At the left part vertically - the numbers of licenses, at the center area - horizontal lines represent not empty licenses, diagonal lines mean migrations of new evolutionary forms between licenses. At the right area - the same events in licenses 1 and 8 in details after 39 cycles. Lines represent fragments of evolutionary trees disposed horizontally. Bifurcation can happen after appearance of mutant. |
 |
Kirill Esin, essine_kv@yahoo.com |
 |
|
|